- Options Decipher
- How To Use The Dashboard
- How To use SmartV Dashboard
- Options Flow Live
- Color Codes and Settings
- Filters For Live Trading
- All Green Settings
- All Green With Calls Only
- All Green With Puts Only
- Options Historical
- Options Watchlist
- Catalyst Trackers
- FDA Tracker
- Earnings Calendar
- IPO Lockup Calendar
- Automated Trading
- Automated Alerts
- Live trading
- Analysis
- Historical Data
Options Decipher
How To Use
Options Decipher analyzes and picks the highest probability trades that has the potential to increase 20 – 50% and at times above 100%. Before you start using real money to trade, test the current trades first by paper trading or use the historical feature to see past performances on winning trades.
How To Use The Dashboard
Dashboard
How To Use The Dashboard
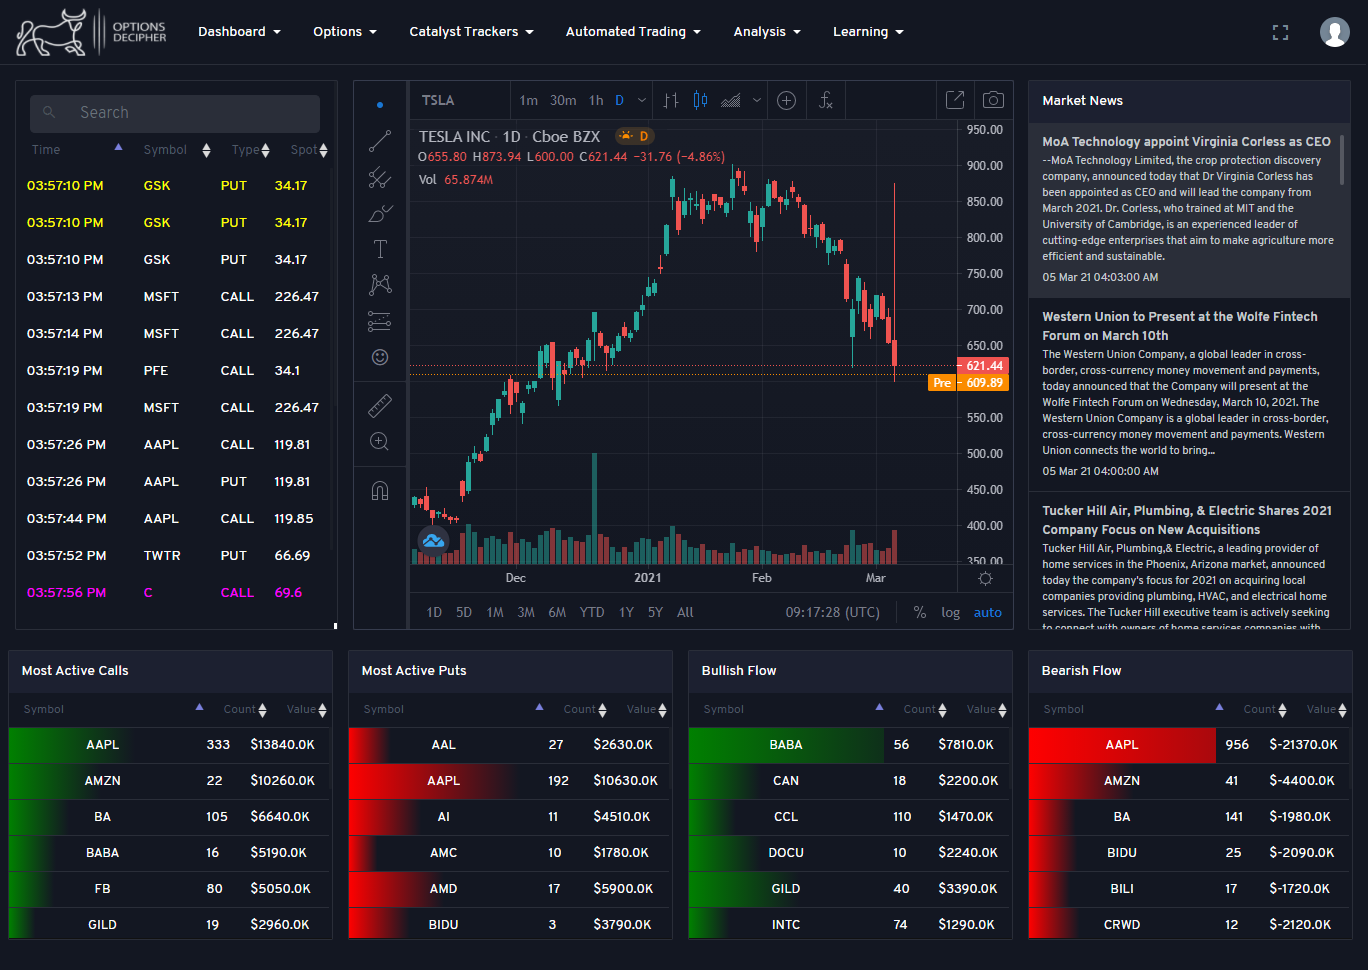
The SmartVision dashboard (SmartV) is has ten sections for a real-time powerful 360 degree look of the Options markets with AI assistance. Each ticker that is selected is update real-time with the price movements volume and the news to guide you into winning trades.
Components
General Market Status Dow, Nasdaq, Headline news
*New Option tracker High percentage Ai selected options
Alerts/Auto trader Customization for alerts or Auto trade to your broker
Charting package Realtime charting package with in-depth package suite
Ticker News News related to the ticker symbol selected
Most Active Calls Compilation of the most calls for a particular symbol
Most active Puts - Compilation of the most calls for a particular symbol
Bearish Flow Ticker symbol with strong Bearish activity
Bullish Flow - Ticker symbol with strong Bullish activity
Market Performers Top performing stock tickers for the day
How To use SmartV Dashboard
Look for the overall trend of the market (Dow and Nasdaq) to get a sense of the overall sentiment.
If the days overall trend is UP (Dow and Nasdaq are positive) look for trades that are Calls.
If the days overall trend is Down (Dow and Nasdaq are Negative) look for trades that are Puts.
Look for trades that are showing on the SmartV dashboard (Left) and select the ones that meet the criteria above. Are trades above or below Moving Average 20 and 200.
Look at the chart and determine where the last spot price was entered that will be your marker for you to decide if its too late or youre right on time to enter the trade.
Check to see how many times the symbol was repeated on the scanner more is better.
Check last time update to ensure trades are current and not exhausted.
If all fits the criteria, enter trade and sit back the trade will do the rest.
Entry
You can trade on any given options of your preference. We recommend trading options that expire at least one month out.
Trade wisely with position sizing.
You can also trade stocks with the signals too. Same guidelines as above.
Holding Trades
Most profits will come in the same day or the next day. We recommend not holding the option no longer than 6 days, after which the volatility declines and trades become stagnant.
Cut your losses and move on to the next trade, there are numerous winners that will come along, so do not get married to any trade. Cut and move on whether its win or lose.
Winning Trades
Safeguard profits 20% and up.
Don't be greedy and expect a 100% and up on all trades all the times. Be wise and take your profits.
If you are in a winning trade start moving your stoploss to safeguard profits.
Options Flow Live
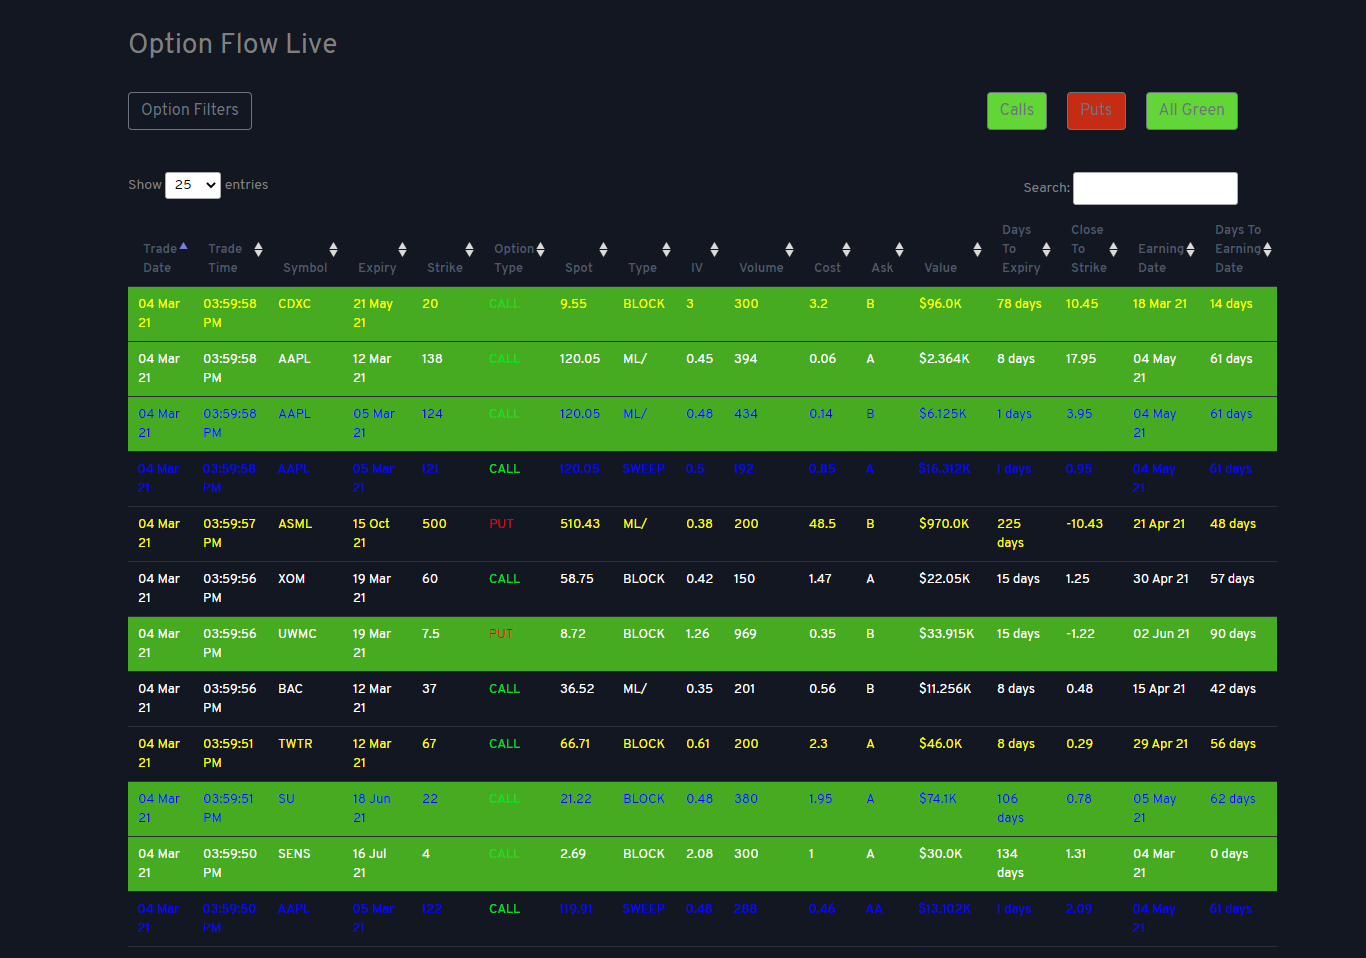
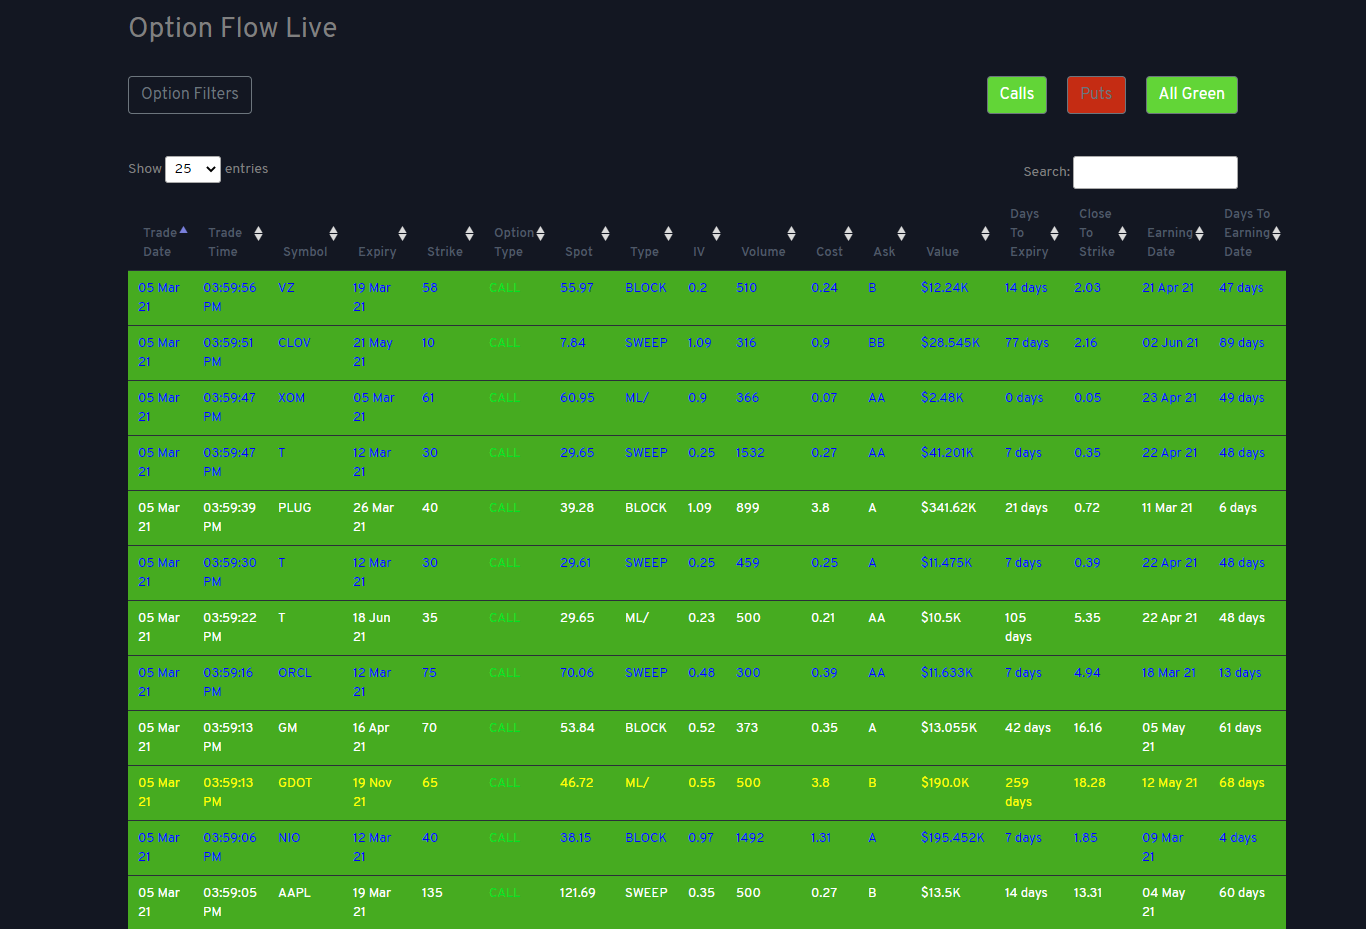
Is the market scanner of institutional trades in real time. It operates only during the market hours and can be customized and filtered to user specifications.
Live Scanner
Color Codes and Settings
Color Codes and Settings
For options to appear in the order flow they have meet criteria to consider any significant value.
White - Represents trades that were placed but does not exceed the Open Interest
Yellow - The Open interest was exceeded in a single trade
Blue -The open Interest was exceeded in multiple trades
Highlighted Green - Double screened filter to highlight potential winning trades
Settings
Trade Date - Date the trade was placed
Trade Time - Time the trade was placed
Symbol - Ticker or symbol of the company traded
Expiry - Date the option expires
Strike - Price at which the option will be considered in the money
Option Type - Call or Put (indicates the direction of the trade)
Spot - Price at which the option was traded
Type - Block or Sweep indicates a single large trade, Sweep indicates large trades broken up in to smaller trades
IV - Implied volatility is the market's forecast of a likely movement in a security's price
Volume - Total amount of options traded in a single trade
Cost - Price of the option
Ask - Price paid for the option
Value - Total amount paid for the trade
Days to expiry - Expiration date for the option
Close to strike - how close to the option price the order was placed
Earnings Date - Date of the upcoming earnings for the company
Days to Earnings date - Quick view to see how many days away from earnings release
Filters For Live Trading
Options Filters For Live Trading
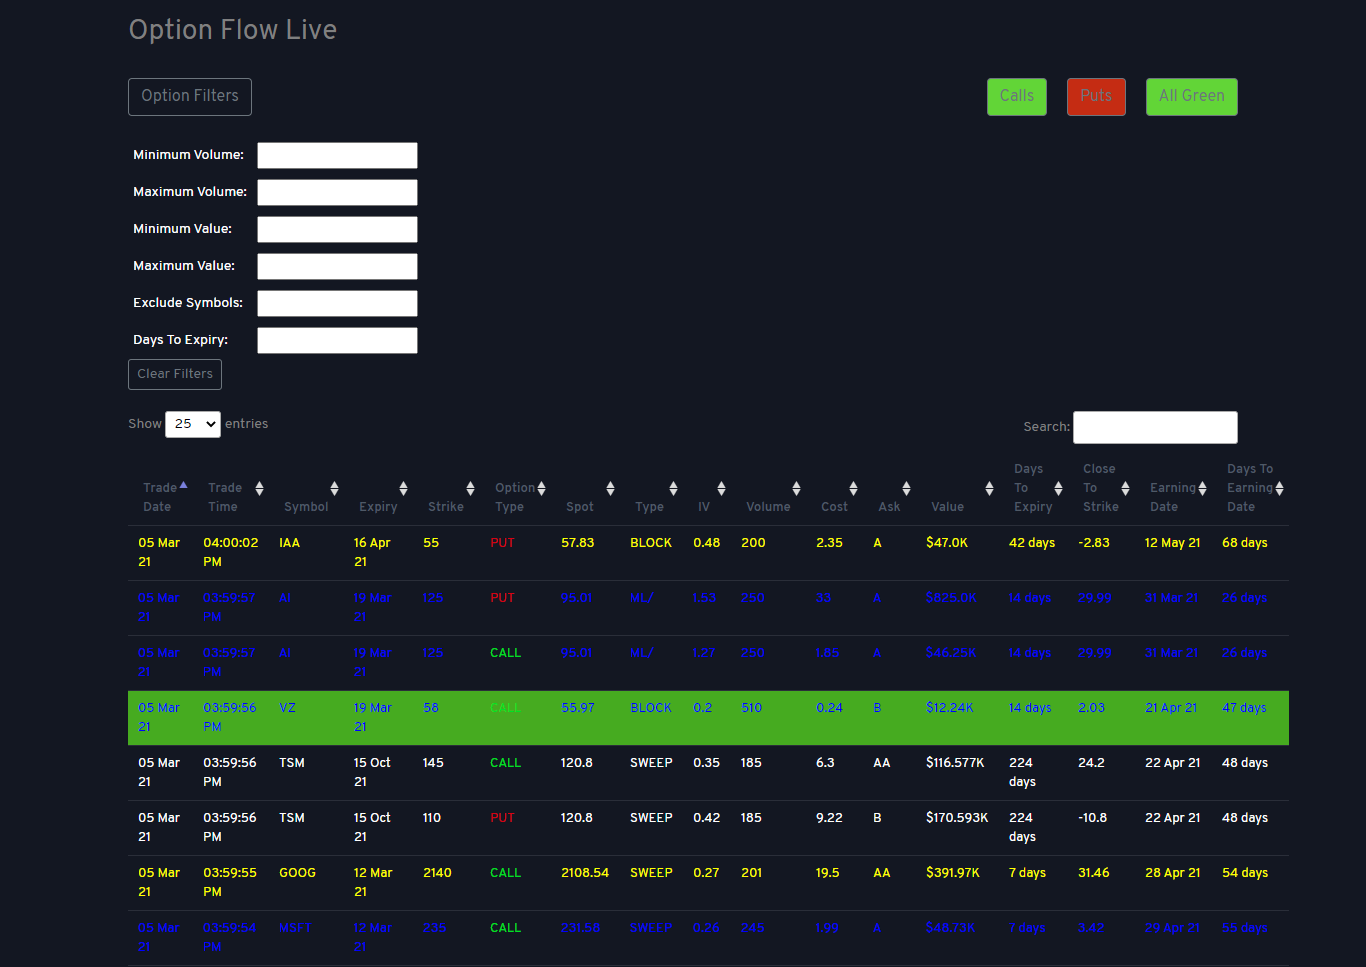
An ideal feature of the platform is its filters to customised the data that is relevant to your trading style. Filters are placed in strategic areas to quickly manipulate the live feed and can be used for testing strategies.
All Green Settings
All Green Settings
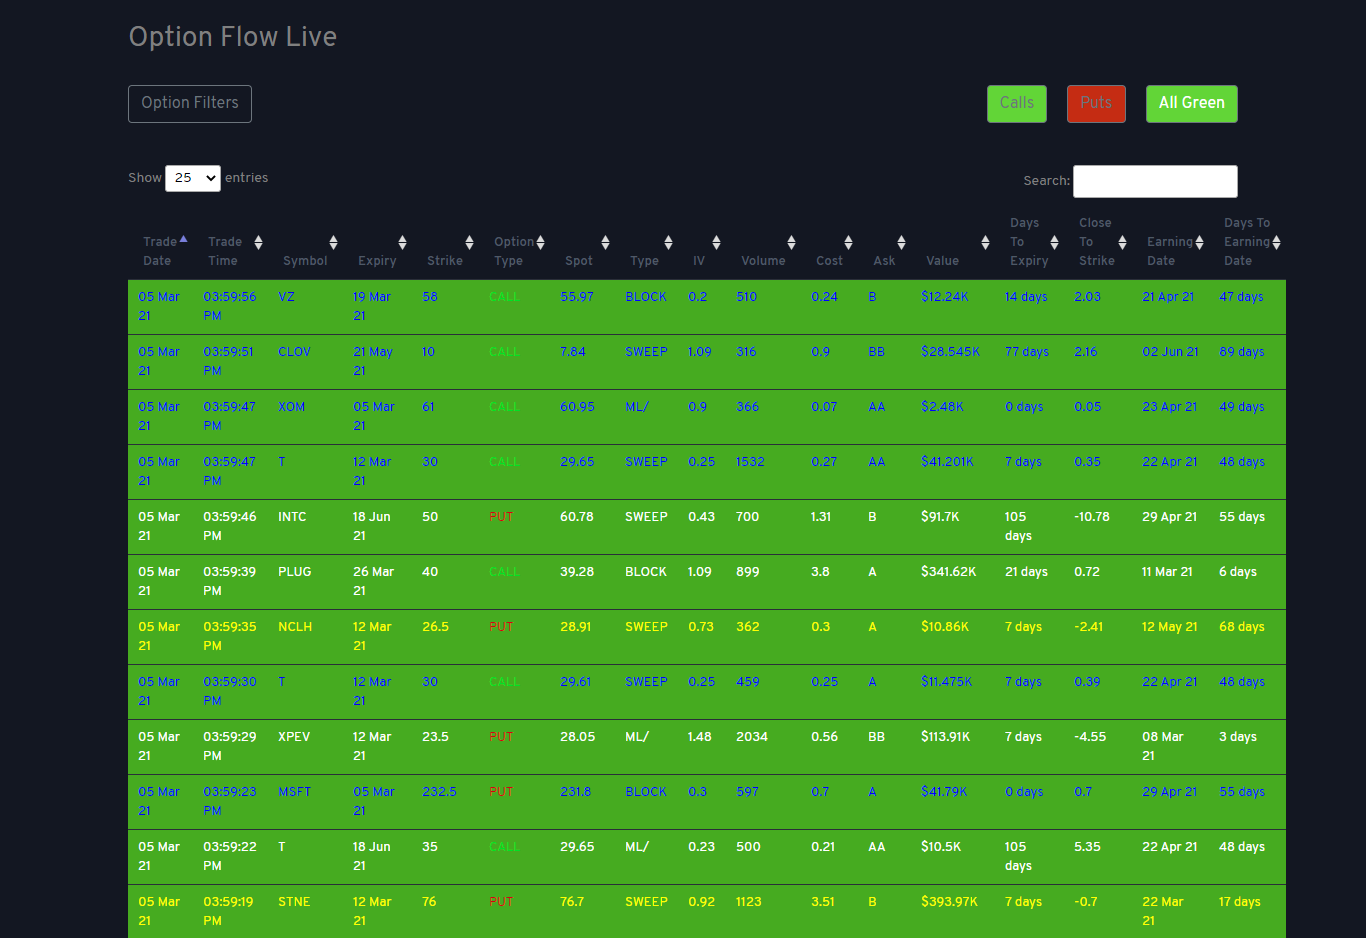
All Green settiings shows options that has trade volumes greater than 300 and highlighted with color green with all trade types shown.
All Green With Calls Only
All Green With Calls Only Setting
All Green settiings shows options that has trade volumes greater than 300 and highlighted with color green with ONLY trading type calls displayed.
All Green With Puts Only
All Green With Puts Only Setting

All Green settiings shows options that has trade volumes greater than 300 and highlighted with color green with ONLY trading type PUTS displayed.
Options Historical
Options Historical
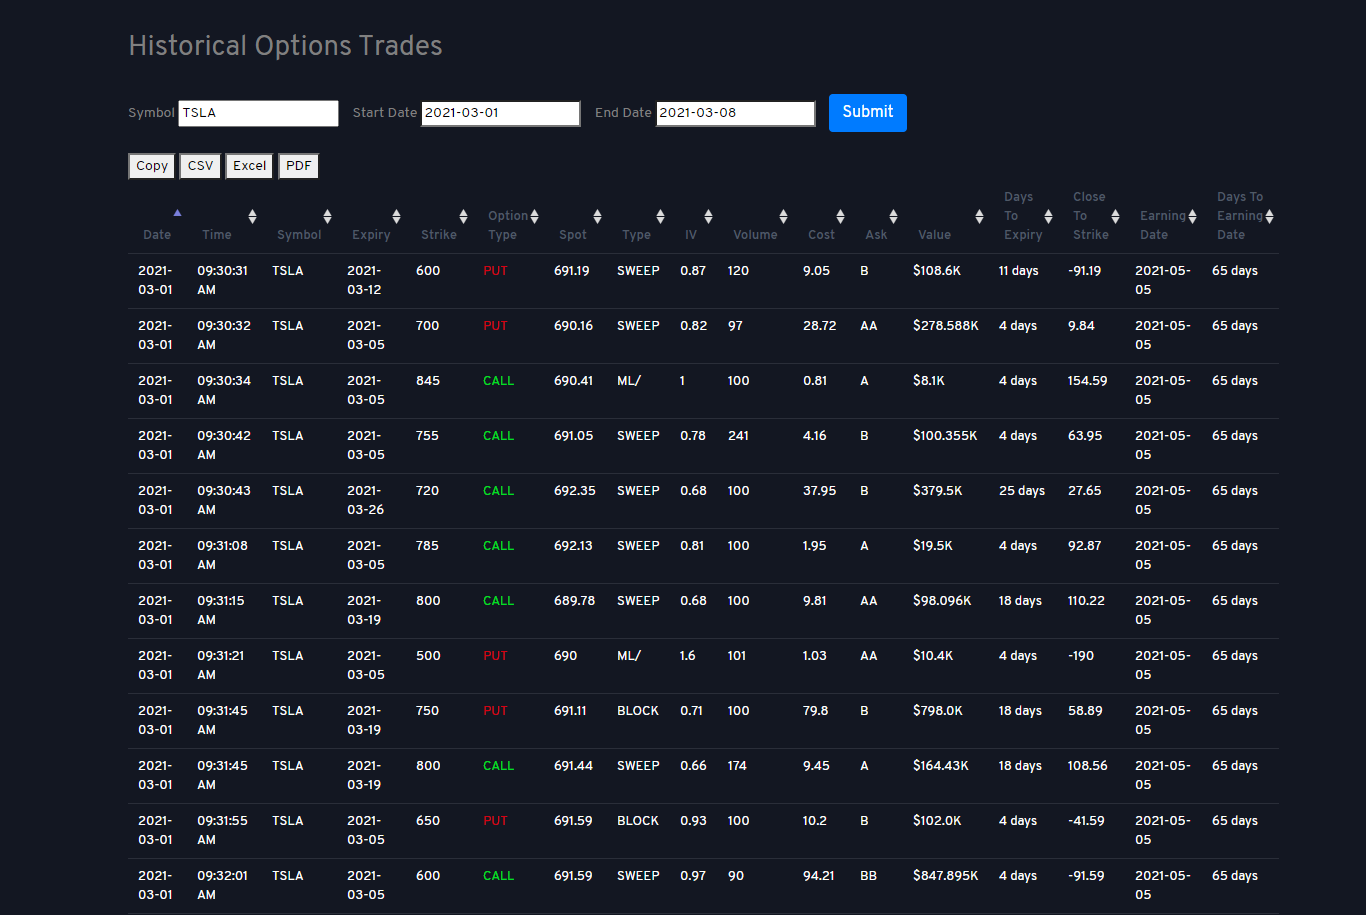
Missed a trade, well, weve got your back. With the historical view you can look back at patterns for any options that was traded in the last 2 years. There are color coded Green sections that shows you high ticket trades which you can export in three different formats for further analysis.
Options Watchlist
Options Watchlist
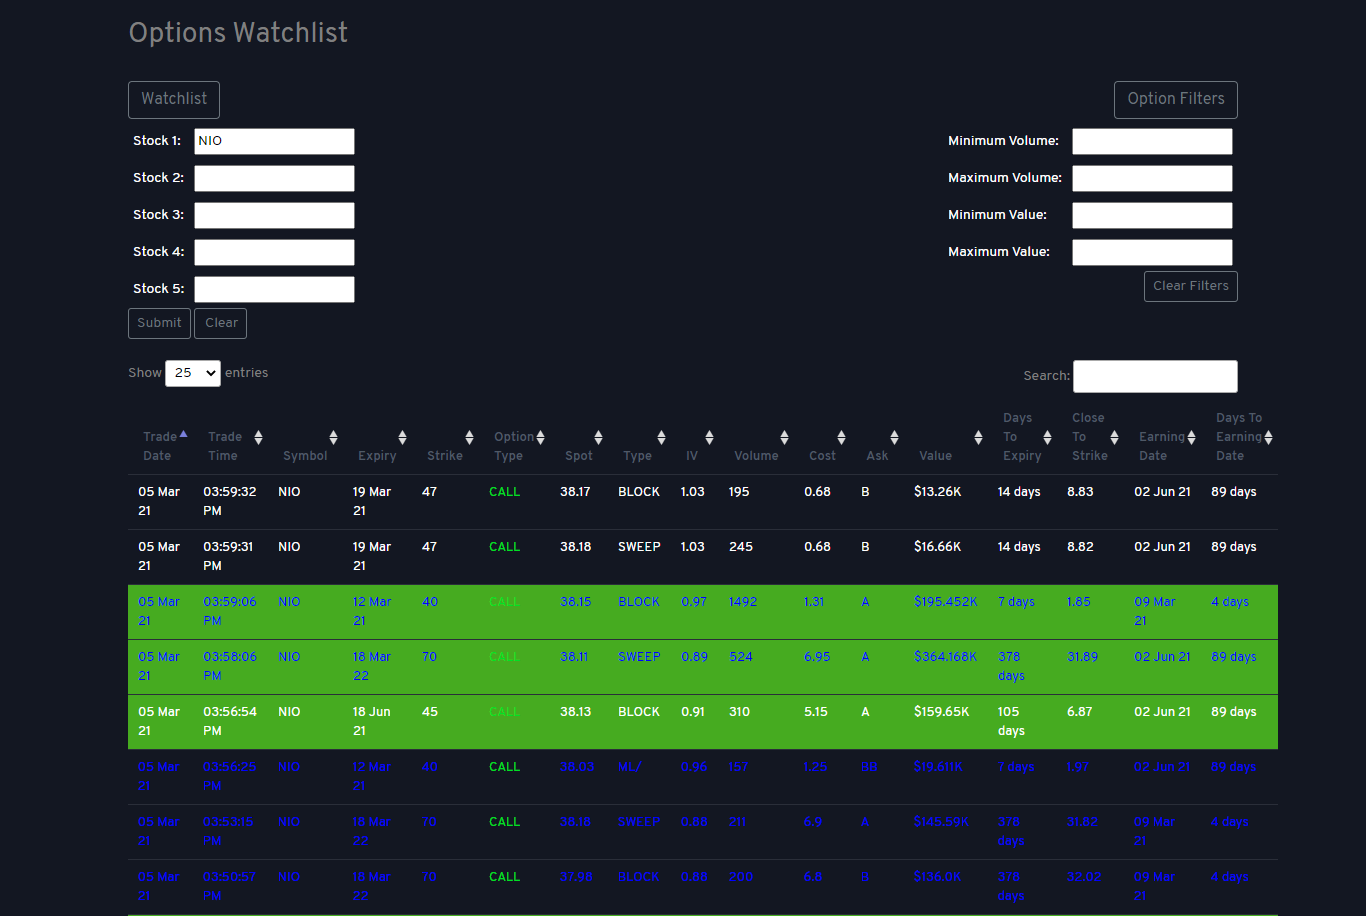
Enter the symbols that you want to watch from the previous days activity.
We call this second shot opportunity, where trades that were missed at the prior days close and has strong potential to increase another 10 -20% the next day.
Selected up to 5 tickers and set the criteria for the options under option filters.
You can also screen for selected options that caught your attention independently.
Catalyst Trackers
Catalyst Trackers
Are stocks that have a due date to report on performance that has the potential to be moon shots or massive falls dependent on the impact of the news. Key exampples are Earnings reports, FDA reports, Mergers & Acquisitions, IPO's, SPAC's etc.
FDA Tracker
FDA Tracker
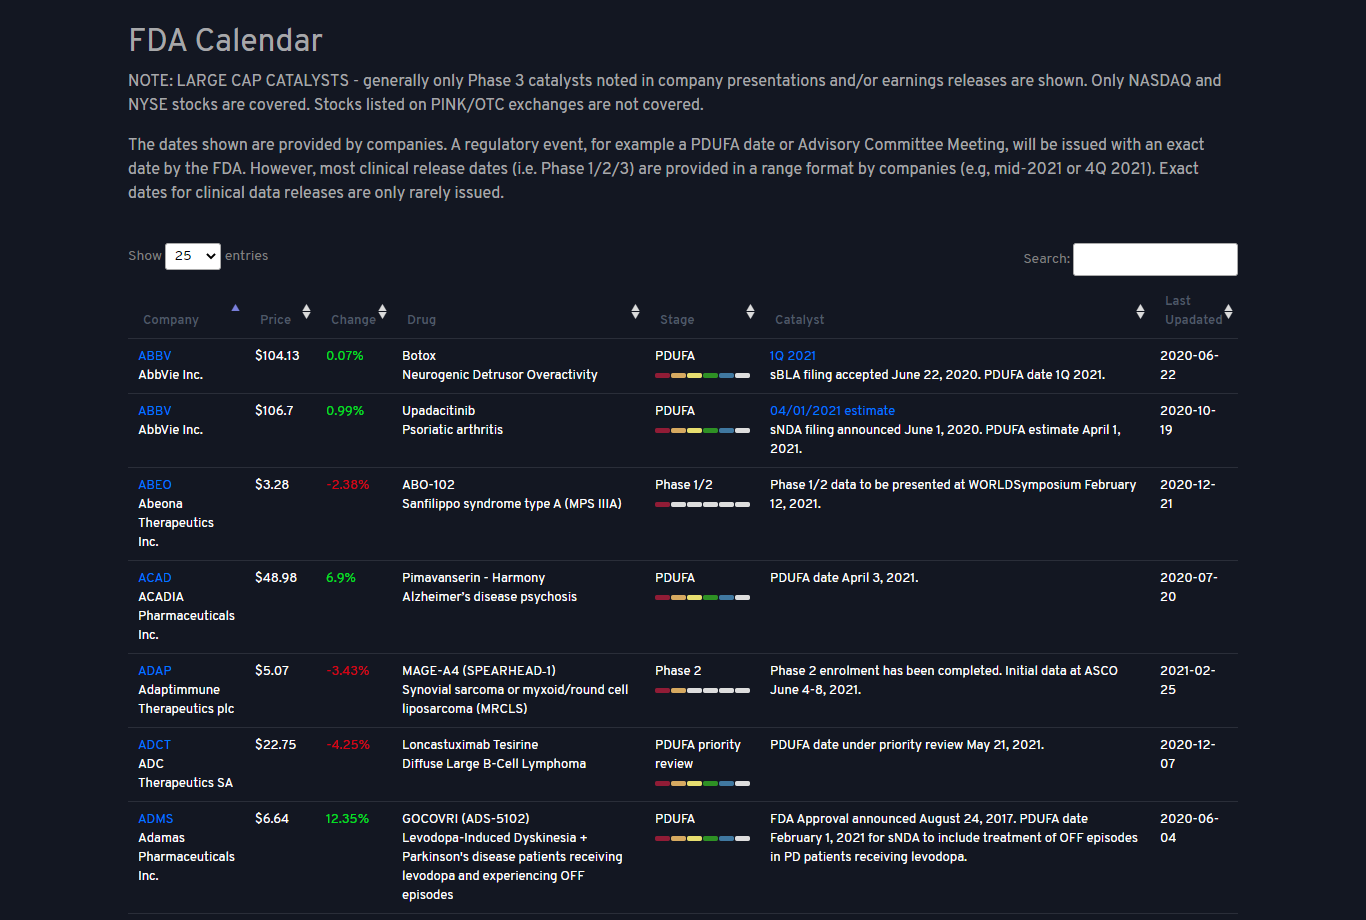
FDA Trackers shows the time and date for clinical announcements/updates for set phases in development for clinical drugs. There are normally 3 development phases, stage 1, stage 2 and stage 3.
Earnings Calendar
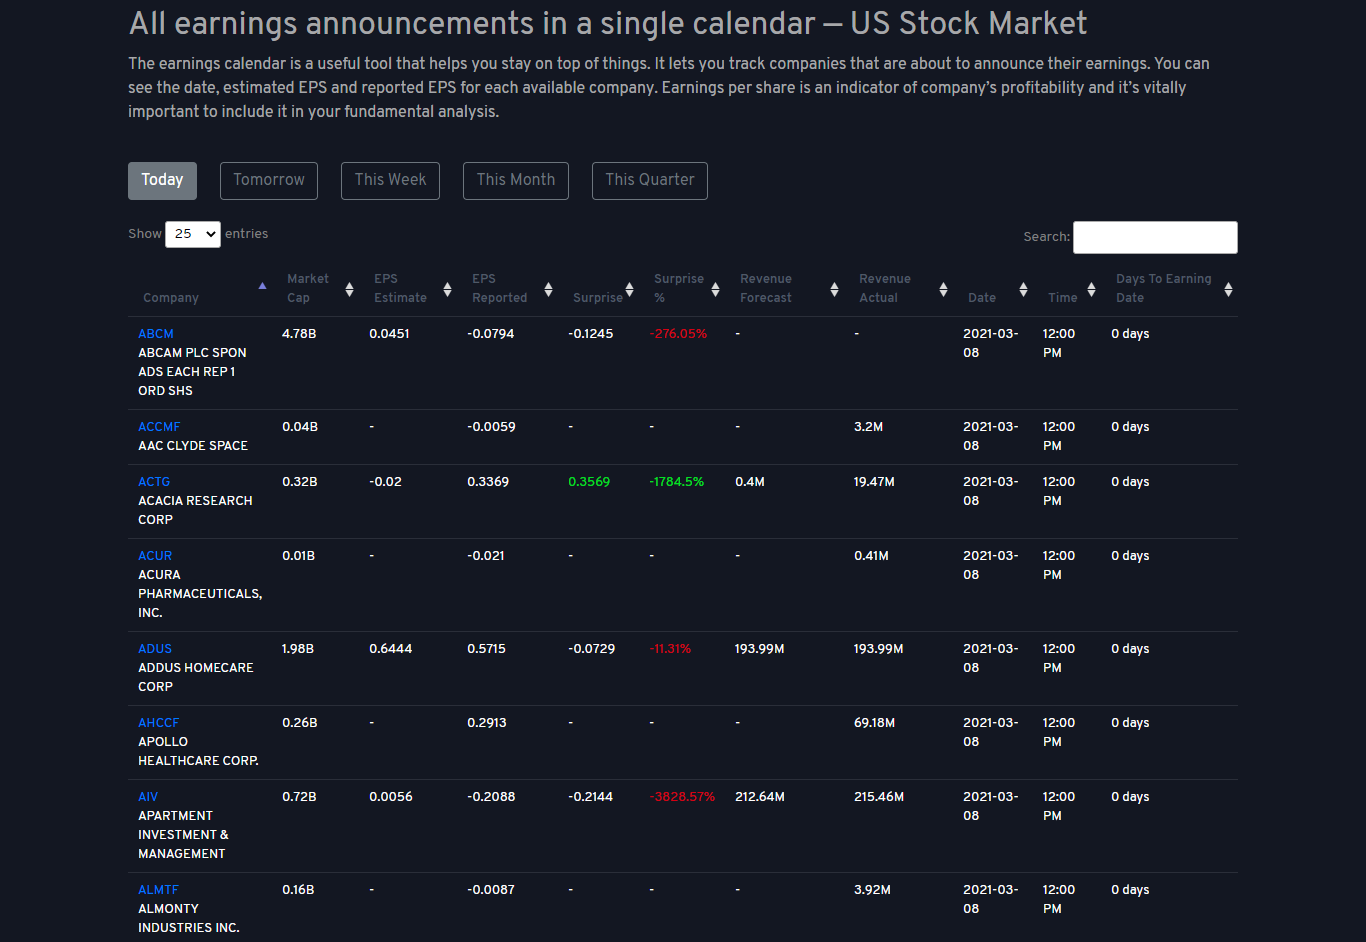
Earnings Calendar
The earnings calendar is a useful tool that helps you stay on top of things. It lets you track companies that are about to announce their earnings. You can see the date, estimated EPS and reported EPS for each available company. Earnings per share is an indicator of companys profitability and its vitally important to include it in your fundamental analysis.
IPO Lockup Calendar
IPO Lockup Calendar
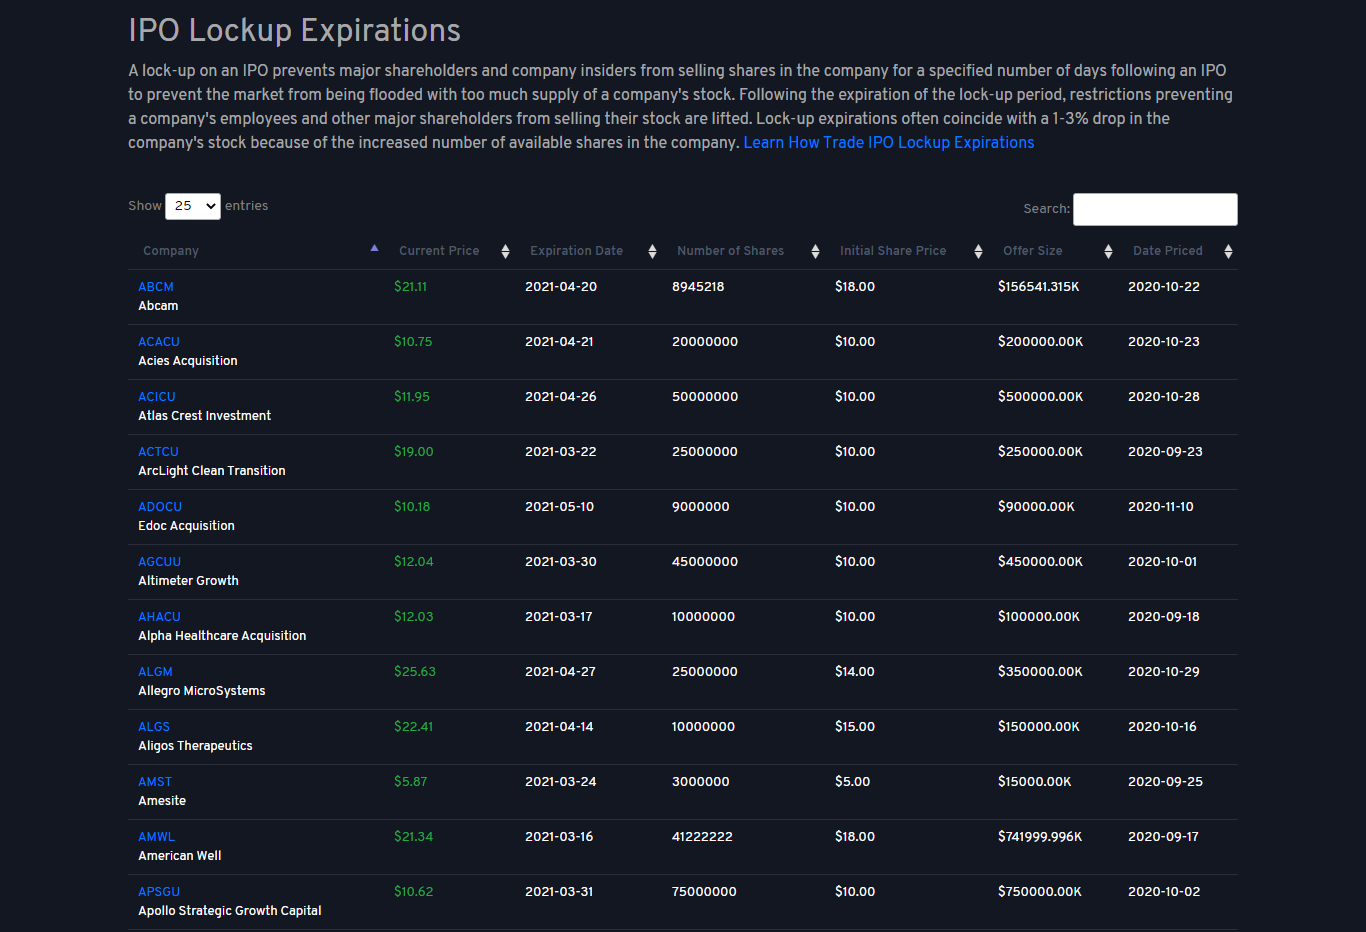
A lock-up on an IPO prevents major shareholders and company insiders from selling shares in the company for a specified number of days following an IPO to prevent the market from being flooded with too much supply of a company's stock. Following the expiration of the lock-up period, restrictions preventing a company's employees and other major shareholders from selling their stock are lifted. Lock-up expirations often coincide with a 1-3% drop in the company's stock because of the increased number of available shares in the company.
Automated Trading
//// Line 241 Coming Soon .
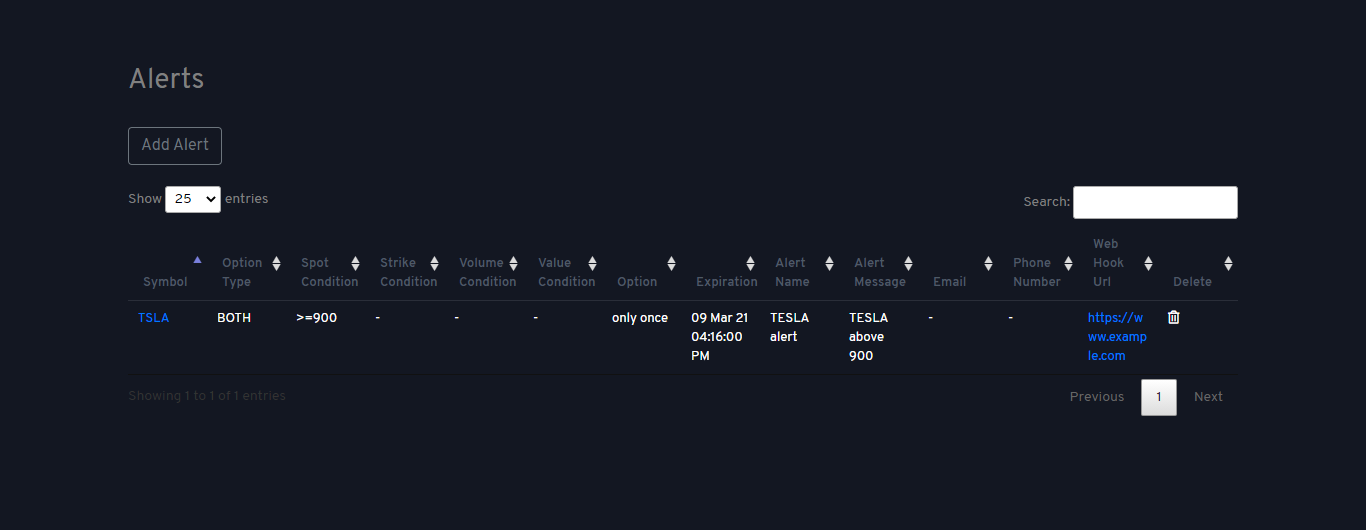
Automated Alerts
Tired of watching the trades, then set alerts with your customized criteria and have them sent directly to your phone, email, or to your brokers platform.
You can also set the same criteria for automated trading to your broker of choice.
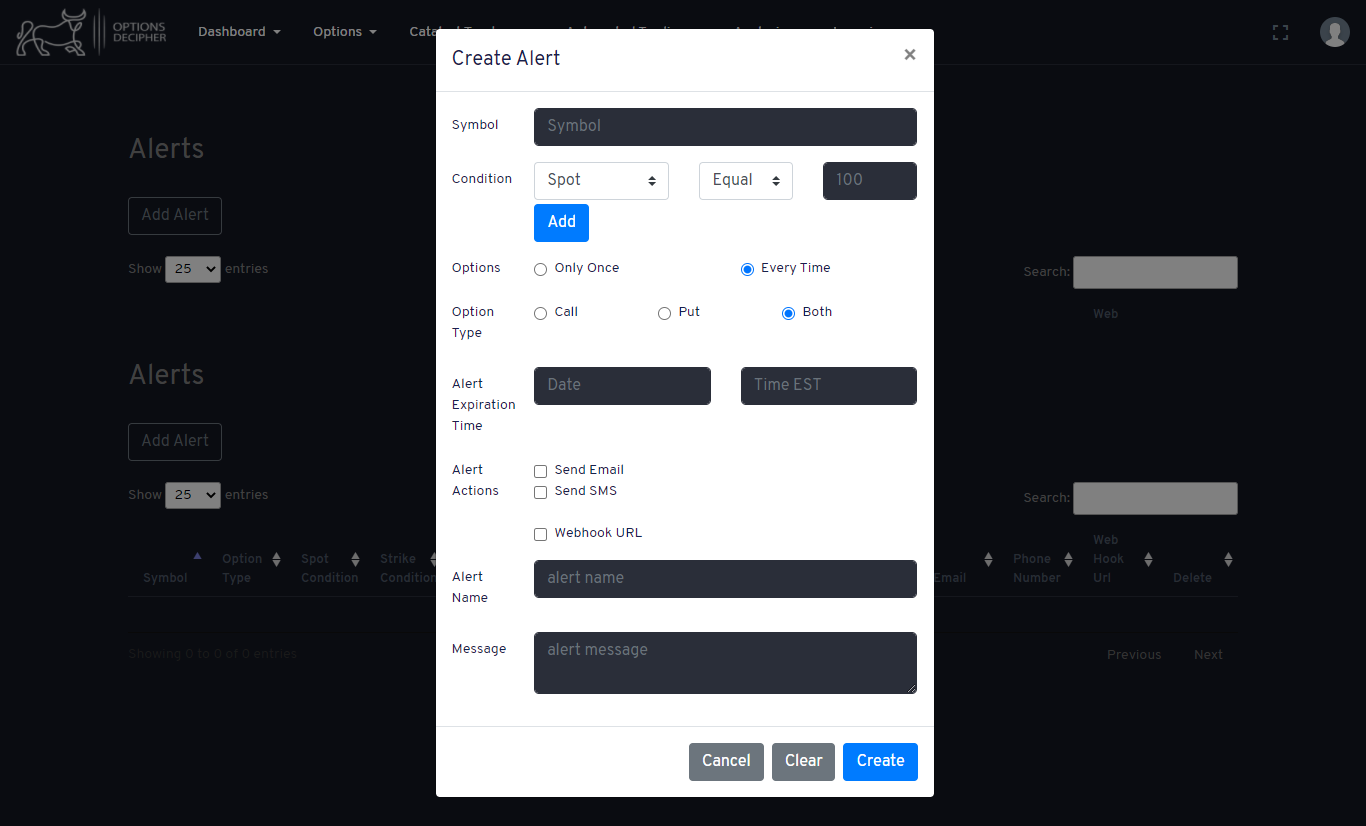
How To Use The Alerts
Click on alerts (A box will pop up with slections)
Chose the selections that fits your criteria
Symbol
Conditions
Type - Calls or Puts
Options update - Currently set at Once or Every time the criteria is met for the option
Expiration for the alerts
Alert Actions - Email, SMS, Webhook URL
Webhook URL - is embedded coding for automated trading. This is used to place trades to the specified brokers
Alert Name - Name you will see in the subject heading (Use headings like NCLH alerts)
Message body - Type short msg to remind you what the alert is for.
Cancel - Click cancel to close the alert
Clear - Click clear to remove all data in the alert form
Create - Click create to create the alert
Live trading
Live Trading
/// Line 275 Coming soon.
Analysis
Analysis
//// Line 282 Coming soon
Historical Data
Historical Data
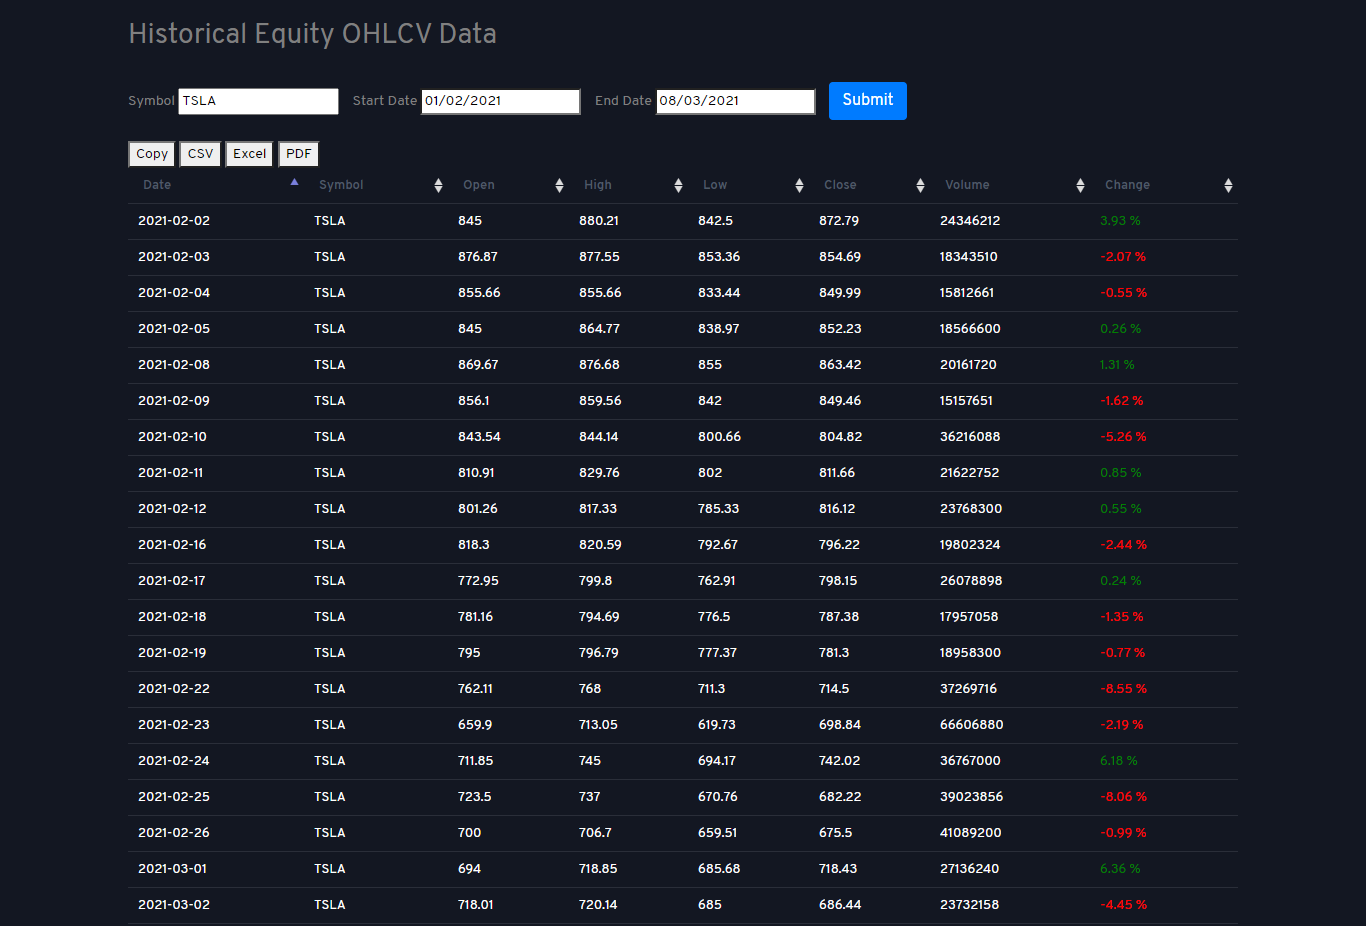
To research historical stock performances, enter the stock symbol and choose the dates of interest and click submit to see historical data. The data will populate showing the trading information below. To download the historical report, click on the buttons Copy, CSV, Excel or PDF to export the data.
Date: Dates the stock was traded
Symbol: Stock ticker eg: AAPL, IBM, GOOG
Open: Represents the opening price of the stock
High: Represents the highest price the stock has achieved for the day or period selected
Low: Represents the lowest price the stock has achieved for the day or period selected
Close: Represents the closing price of the stock at the end of the day or period selected
Volume: Total volume traded on the symbol for the day or period
Change: Represents the percentage change of the stock at the end of the period